Ever wondered what the ins and outs of Social Media Tracking and Reporting are? If you answered yes to this question - then you're in luck! This article gives an overview of what Social Media Tracking and Reporting is, as well as a glimpse into how it is used in the workplace.

What is Social Media Tracking and Reporting?
Over the years, and with the advancement of technology, social media has become a vital part of the expansion of many businesses. With the rise of social media, companies are now able to connect with more people worldwide than ever before. The expansion of social media has also brought about the creation of sites and tools that allow you to track engagement with your target market as well as your competitor's social media accounts and compare them to your company's.
Why is Social Media Tracking and Reporting Important?
In a field as competitive as marketing, competitor analysis tools are a must. These tools and sites allow you to get an edge up on your competition and save you hours of the rigorous stalking of their social media platforms that would otherwise occur.
Having a leg up on your competitors is crucial in this field because if you aren’t competing at the same level or above, then you’re losing revenue.
These tools allow you to look at:
- the type of content that your competitors are posting
- how often they post
- what consumers think about your competitors products and services
- how much traffic their posts get
- identify trends, etc.
These sites also help you get a better grasp of your own company's social media accounts and how much traffic and interaction they get on a daily, weekly, and monthly basis.

What platforms can be tracked and monitored effectively?
Social media platforms that can be tracked and are most commonly tracked include:
- YouTube
These platforms are some of the most popular ones you’ll find and pretty much anyone you talk to nowadays has one (despite older generations….sorry gram and gramps).
You’ll also find that almost every company, no matter the size, has at least an Instagram, Facebook, or Twitter, or all three and others! Because these platforms are the most favoured they are also the most commonly tracked on these sites.
How Tracking and Reporting works for LinkedIn
In the corporate world, LinkedIn is a very commonly used platform that focuses on career development and professional networking.
(Note: because of privacy reasons, personal accounts are not able to be tracked, only business pages are).
This site can be tracked by:
- Audience
- Followers Trend
- Competitors Comparison
- Total Followers
Audience: This is your page's total follower count over a given period of time. This allows you to track your potential growth or decline in your audience. You can customise the date range by selecting which dates you would like to see, by simply clicking the dates on the calendar.
Followers Trend: This bar or line graph allows you to see your followers trend over time. With this you are able to track the amount of followers you are gaining or losing. Also, your followers trend can be categorised into daily, weekly, or monthly data.
Competitors Comparison: With this helpful tool, you will be able to directly compare your total number of followers to that of your competitor's. You are able to view your number of followers on both the Total Followers Chart and the Trend Graph at the bottom of the section.
Total Followers: Lastly, the Total Followers Chart gives you access to a breakdown of your competitor's total followers and their changes in growth rates. This data can be sorted by either of the three metrics: total followers, change, or growth %.

How Tracking and Reporting works for Facebook
Facebook is another example of a commonly used platform for social media tracking. You can compare the prosperity of your Facebook page to that of your competitor's in an array of ways.
Reporting categories are separated into:
- Posts
- Audience
- Activity
- Engagement
- Hashtags
Posts: In this section you can view your competitor's recent Facebook posts. You can adjust the date range to see posts from as far back as you want. With the “post types” selector, you are able to see all types of posts, just photos, just videos, or just links. You can also filter posts by entering a hashtag of your choosing. This section also has a tab called Total Engagement, which is the sum of all the shares, likes and comments on a post.
Audience: This section offers a more in depth look at your company’s Facebook viewers. In this section you are able to see the summary of total page likes, number of likes within a certain date range, amount of audience change, and the growth %. At the bottom of the Audience section you can find two graphs. One titled Page Likes Trend and the other called Total Page Likes Compared to Competitors. These graphs allow you to look at your page's likes from a daily, weekly, and monthly basis and then compare them to your competitor’s.
Activity: This portion shows your company’s posting habits and trends. You can look at how many posts your company has published in a certain time frame, as well as what types of posts engage the audience differently.
Engagement: This area shows your company’s total engagement on Facebook. That means it measures the sum of all comments, shares, and reactions on your profile. The Engagement Summary breaks down the total engagement number into specific reactions, comments, and shares columns. The last parts of this section are the Comparison Graphs. These graphs display your company’s engagement with your audience compared to your competitor's engagement with theirs.
Hashtags: This section lets you see the most intriguing hashtags used by your company and your competitor's. With this tool you can look at which companies used certain hashtags. Also, the “Engagement per post” allows you to see the total engagement per post with each hashtag.

How Tracking and Reporting Works for Twitter
Twitter gives people a platform to post whatever thoughts they might have at any given time. At a max of 140 characters, these thoughts can range from random food cravings to what someones political beliefs are. This platform is used by a wide range of people, varying from students, companies, politicians, policy makers, and the general public. Many companies use it to promote their research, build relationships with followers and other companies, and to reach new audiences.
Tracking for this platform is sectioned into….
- Tweets
- Audience
- Activity
- Engagement
- Hashtags
- Mentioners/Mentions
Tweets: This section analyses tweets from competing companies. Here you can compare how engaging, liked, and retweeted your posts are, compared with other companies.
You can sort your columns by:
- engagement rate
- total engagement
- likes
- replies
- retweets
You also have the option to filter your tweets by hashtags or tweets type. Tweets type is then filtered by:
- photos
- statuses
- videos
- and links
Users can also export a list of tweets from this report to a spreadsheet or PDF.
Audience: This tab allows you to review the size and growth of your company compared with your competitor's. You are also able to evaluate the trend of your company’s overall Twitter follower count over a daily, weekly, or monthly basis. The last graph in this section lets you view your company’s growth % relative to your audience size. You can then compare this data to that of your competitor's.
Activity: This area gives you a better understanding of the behaviour of your competitors on Twitter. In a selected date range you are able to see the company’s total number of tweets, tweets per day, and any increase or decrease in the company’s tweeting behaviour. Users are also able to look at which type of tweets get the most engagement with their audience in comparison to their competitor's.
Engagement: This segment lets you view your engagement trends over time as well as your competitor's. This graph gives you a breakdown of your score by likes, replies and retweets. The bar graph at the bottom also shows your profile’s engagement rates on a daily basis over a selected date range.
Hashtags: This report allows you to view a list of all the hashtags used by a profile. Here you are able to see which competitors had the most engaging hashtags.
Mentioners/Mentions: This section gives you a list of all the Twitter profiles that mentioned your competitors. You are able to measure the amount of mentions your page gets verses your competitor's.
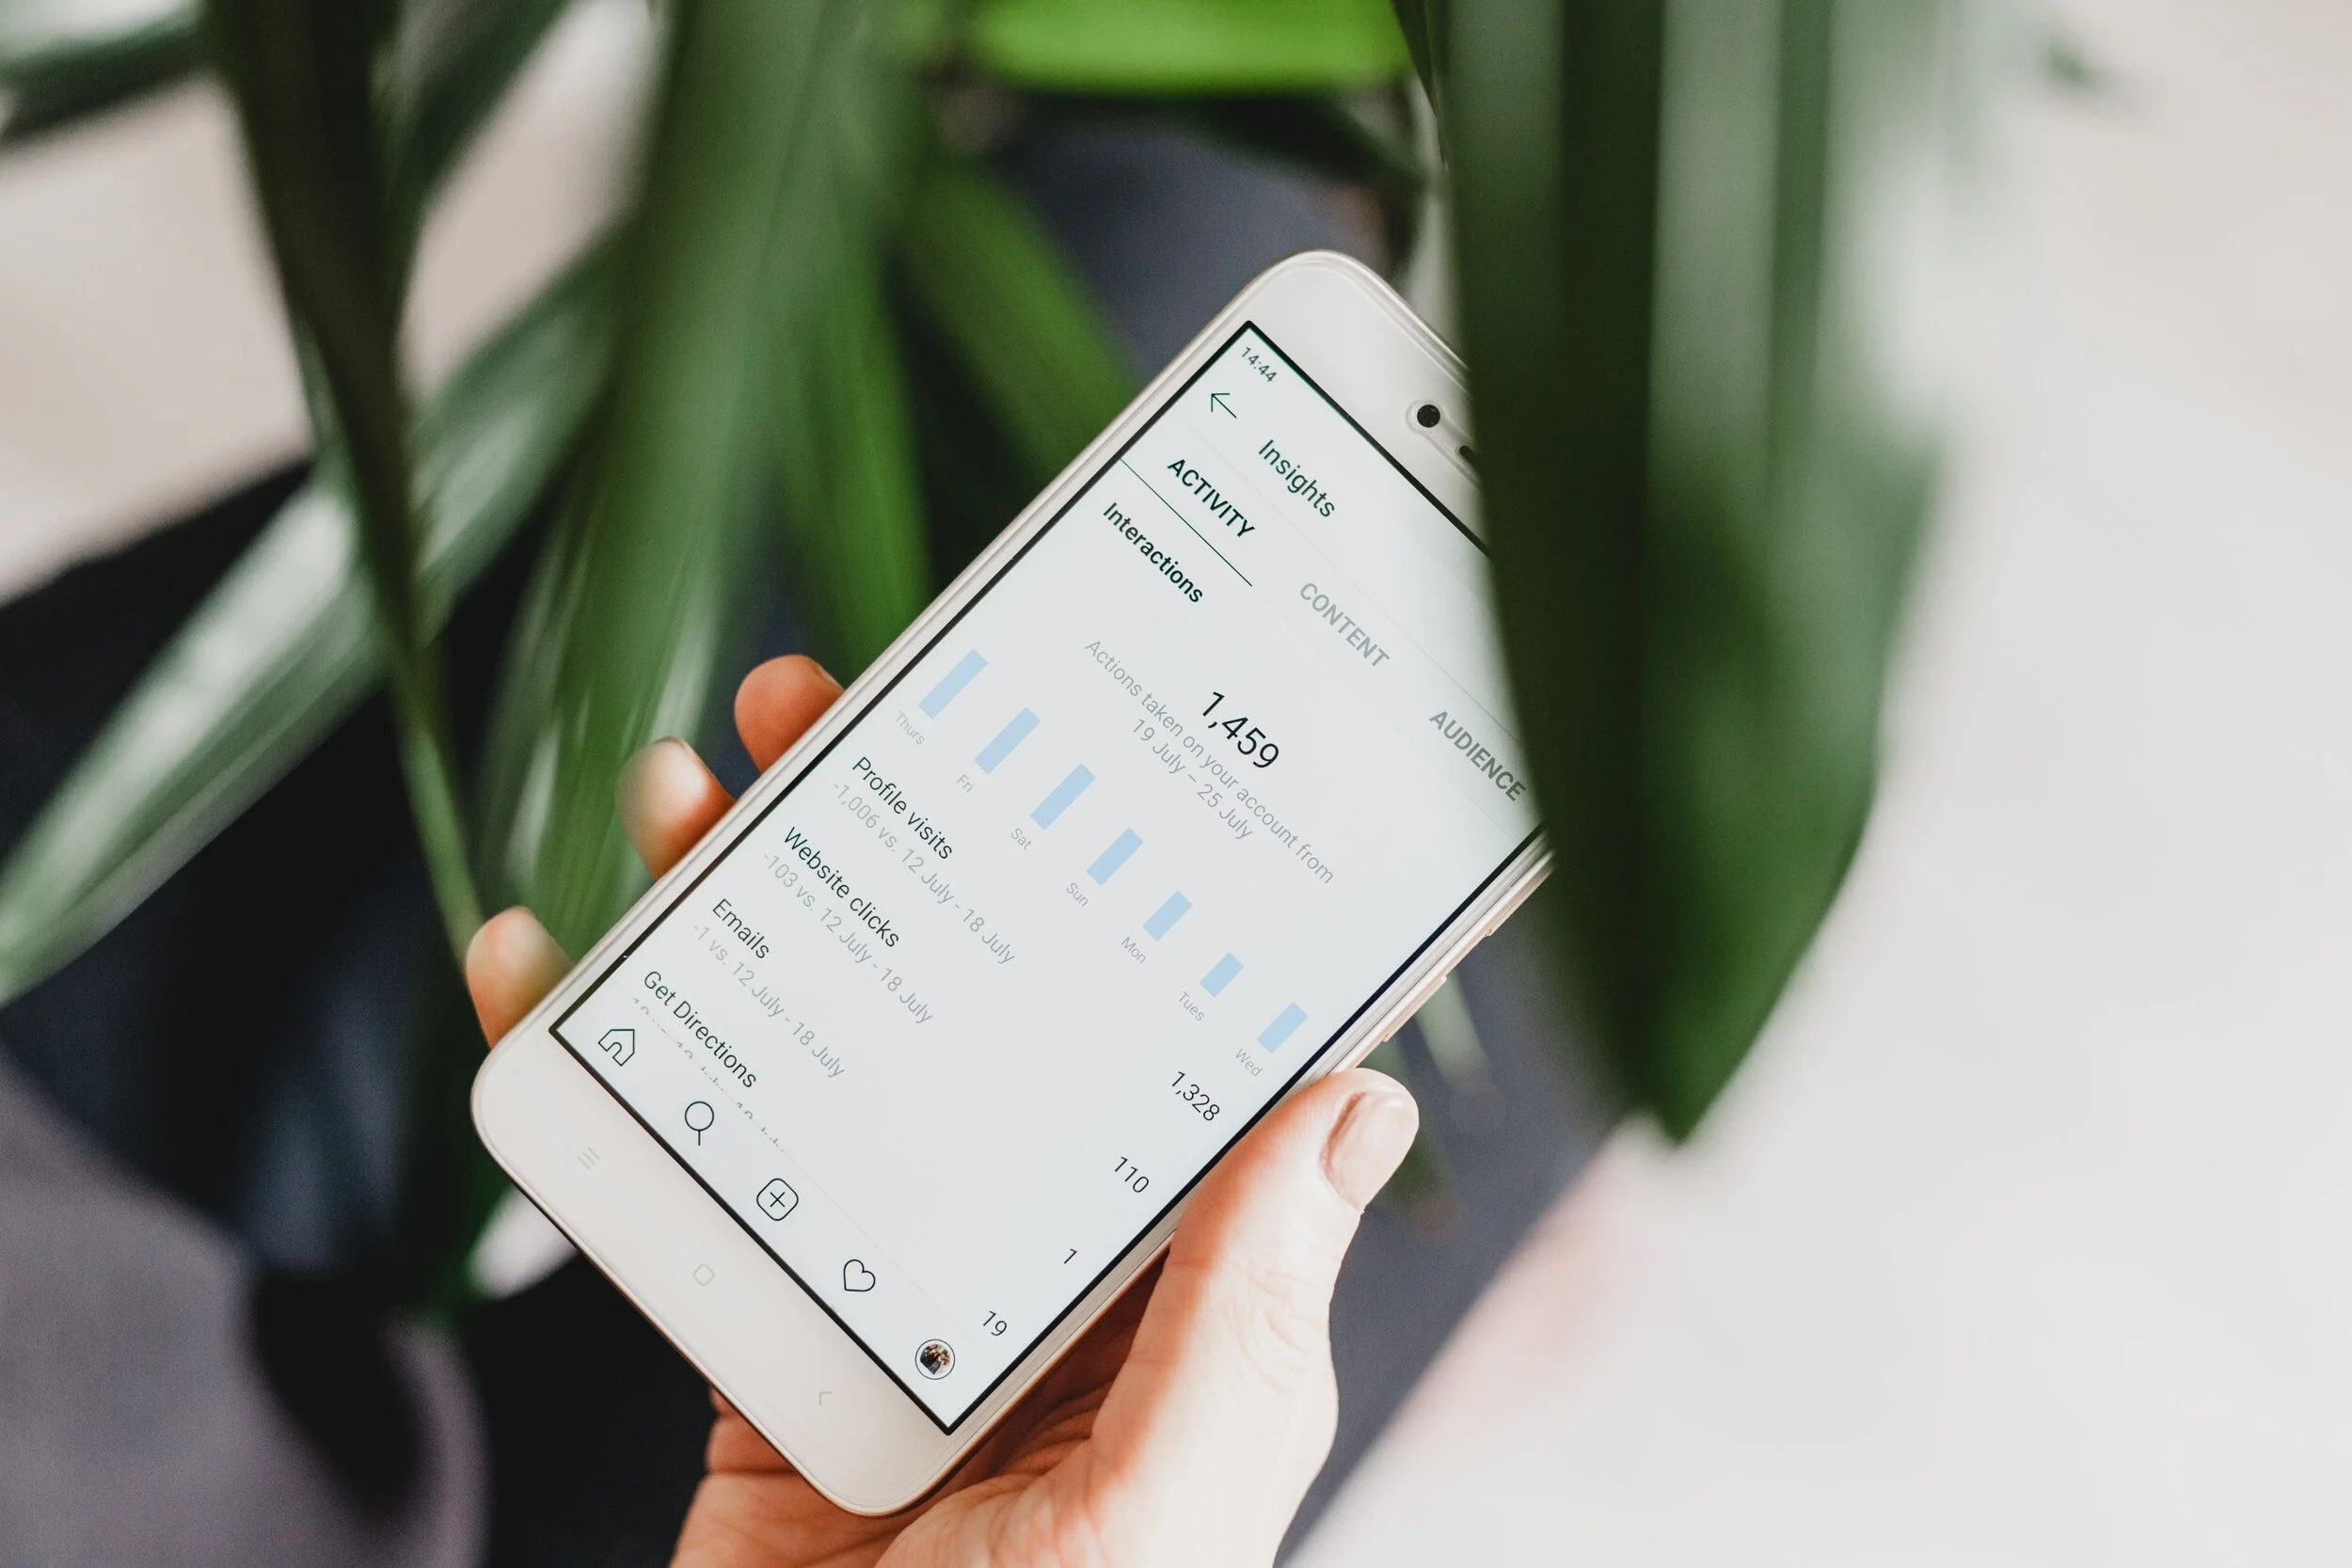
How Tracking and Reporting Works for Instagram
Instagram is a social media platform that allows you to connect with millions of people worldwide through the sharing of photos and videos. Instagram is used daily by the general public, celebrities, influencers, politicians and many companies as well. Tracking for this site allows companies to compare their instagram posts’ performance to their competitor's.
This program is organised by:
- Posts
- Audience
- Activity
- Engagement
- Hashtags
Posts: This section allows you to look at both your company's posts as well as your competitor's. In this section you can also filter posts by the type of content posted and hashtags.
Audience: In this portion you are able to see the change in your company's amount of followers. You also have the ability to observe your daily, weekly, and monthly follower trends.
Activity: This tab lets you track your instagram activity. Here you are able to observe your publishing trend and post performance. You can track your company’s progress compared to your competitor's via comparison graphs at the bottom of the section.
Engagement: In this segment you are able to view how your engagement dynamics have changed over time. You are able to see your followers reactions to your posts and the type of feedback each post gets. Here you are also able to compare your posts feedback with that of your competitor's.
Hashtags: This area gives you a list of hashtags that have been used in instagram posts. You are able to see which hashtags perform best and which ones are common to your competitor's. Here, you can see how to improve your engagement rate.